The Music Was Always Going to Stop
Quarterly NewsletterWhat this quarter's pullback really means - and why diversification was always the right answer
By Dr. Robert Votruba
There is an old saying on Wall Street: trees don’t grow to the sky. For the better part of three years, the “Magnificent Seven” - Alphabet, Amazon, Apple, Meta, Microsoft, Nvidia, and Tesla - seemed determined to prove that adage wrong. They dominated headlines, dominated index returns, and dominated investor portfolios in ways rarely seen in market history. At their peak, these seven companies represented more than a third of the entire S&P 500 by market capitalization. When a handful of stocks carry that much weight, the index becomes less a measure of the broad economy and more a referendum on a very small group of very large companies.
In the first quarter of 2026, the music stopped, at least briefly. And if we’re being candid, it was probably overdue.
What Happened This Quarter
The first quarter was uncomfortable by almost any measure. The S&P 500 declined approximately 4.6%, and the Nasdaq fell more than 7%, the worst start to a year for both indexes since 2022, when Russia’s invasion of Ukraine rattled global markets. The proximate cause this time was the U.S. and Israeli military strike on Iran in late February, which sent oil prices sharply higher and triggered a broad risk-off selloff across global markets. As the Strait of Hormuz, a narrow waterway through which roughly a fifth of the world’s oil flows, became a flashpoint, energy prices spiked and investors grew nervous about renewed inflationary pressure arriving just as the Federal Reserve had hoped its work was nearly done.
The Magnificent Seven bore the brunt of the decline. All seven stocks finished the quarter in the red. Microsoft led the way down at approximately 21%, with Amazon, Nvidia, and Tesla not far behind. Apple was the relative “winner” of the group, declining roughly 6%. The Roundhill Magnificent Seven ETF, which tracks the group as a basket, fell by double digits.
That is the what. The more important question is the why, and the answer has two parts.
A Trigger, and Something Deeper
The geopolitical shock was real. Oil price spikes are historically disruptive, and a broader Middle East conflict raises legitimate concerns about inflation, supply chains, and global growth. Markets responded accordingly.
But to attribute the entire selloff to the war in Iran would be to miss something more fundamental that was already underway. The rotation away from mega-cap technology actually began last November, well before the first shot was fired. Consider the setup. U.S. stocks rose for nine consecutive months from May 2024 through January 2025, the longest winning streak since 2018. The Magnificent Seven were the engine of much of that run, trading at valuations that, by early 2026, had reached levels not seen since the height of the dot-com era.
When leadership becomes that narrow and that expensive, it tends to become fragile. Markets are efficient enough, eventually, to recognize when a good story has been priced in. What we witnessed this quarter was not simply fear. It was, at least in part, reversion to the mean: a gravitational force that every investor knows exists but always seems surprised to feel.
The chart below captures this dynamic better than any words can. Each green bar shows the S&P 500’s final annual return for a given year. The dark green dot above it shows the biggest rally within that year. The red dot below shows the biggest decline. What becomes immediately clear is that every year, even the strong ones, contains meaningful turbulence along the way. In 2025, for example, the market fell as much as 19% at its worst point before finishing the year up 18%. That intra-year decline felt alarming in the moment. In hindsight, it was the setup for the rally that followed. The red dots are not the story. The green bars are.
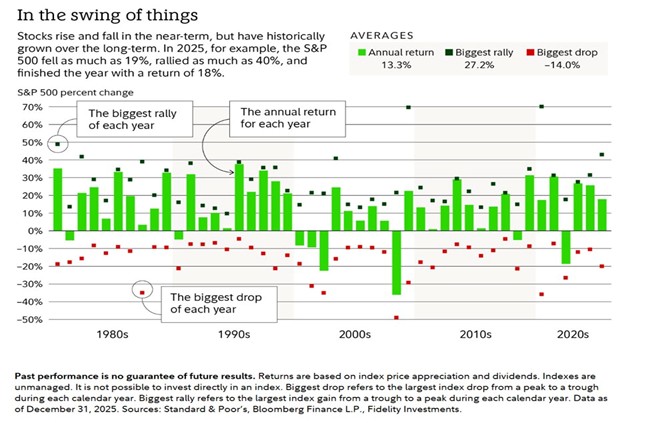
Source: Standard & Poor’s, Bloomberg Finance L.P., Fidelity Investments
Geopolitical Events and the Long View
It is worth pausing on the geopolitical dimension, because the instinct to “do something” during moments of conflict is powerful and understandable. History, however, consistently argues against it.
Looking back at major geopolitical shocks, from the Cuban Missile Crisis to the September 11th attacks to Russia’s annexation of Crimea, markets have shown a remarkably consistent pattern: short-term disruption followed by recovery. Even events that felt, in the moment, like potential turning points for the global order proved temporary in their market impact.
The table below tells the story clearly. Next to the U.S. and Israel attack on Iran in February, the columns for “3 months after,” “1 year after,” and “3 years after” show only question marks. Those question marks are the honest answer. But if history is a guide, the pattern is likely to rhyme with what came before.
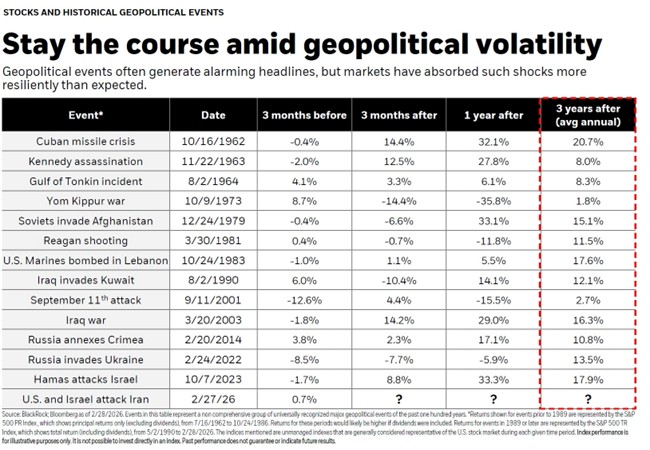
Source: BlackRock, Bloomberg as of 2/28/2026
Your Financial Plan Was Built for This
Here is something worth remembering during quarters like this one: if you have an established financial plan, this decline was already accounted for. Not this specific quarter, not this specific cause, but a decline, at some point, of some magnitude. That assumption is baked into every plan we build.
We stress-test financial plans against market downturns as a matter of course. Whether your goals involve retirement income, education funding, or long-term wealth accumulation, the plan was never built on the assumption that markets move in a straight line upward. It was built on the assumption that they won’t, and that your goals remain achievable anyway. A quarter like this one is not a deviation from the plan. It is, in a very real sense, part of it.
This distinction matters because it changes how you experience volatility. When a decline arrives and your plan has already accounted for it, the appropriate response is usually the same as it was before: stay the course, rebalance if necessary, and let time do the work. When a decline arrives and investors feel unprepared for it, the temptation to react - to sell, to wait, to “do something” - becomes far more powerful. And as decades of research consistently show, that reaction is almost always the most expensive mistake an investor can make.
The Case for Diversification, Validated Again
Here is where this quarter’s story becomes genuinely encouraging for long-term investors: a diversified portfolio held up far better than a concentrated one.
While the Magnificent Seven struggled, the rest of the market quietly held its ground. The equal-weighted S&P 500, which gives each of the 500 companies the same representation, significantly outperformed the market-cap-weighted index. International stocks, which had already delivered roughly 30% in 2025, continued to show relative resilience. The U.K.’s FTSE All-Share delivered a positive return of 2.4% in a quarter when U.S. tech stocks were falling sharply. Bonds, while not immune to the oil-driven inflation concerns, still served their purpose: providing ballast against equity volatility.
This is the power of diversification, not as a theoretical concept, but as a lived experience in real time. When investors held only the headline names, they felt every point of the decline. When they held a broader portfolio, the experience was meaningfully smoother.
A Word on Risk — and What It Actually Means
When investors hear the word “risk,” they often imagine one thing: losing everything. That fear, while understandable, is a different creature from what investment professionals typically mean by the term. In finance, risk is most commonly defined as volatility - the degree to which a portfolio fluctuates in value over time. A bad quarter like this one is volatility at play. Permanently losing capital is something else entirely, and it is largely a function of how you invest, not whether you invest.
The distinction matters enormously, and a recent Morningstar study of the technology sector, one of the most extraordinary performing segments in market history, makes the point with unusual clarity. Even in tech, during one of the greatest multi-decade runs any sector has ever produced, picking individual stocks was more likely to cost you money than make you money. Over the past five years, 59% of individual technology stocks lost money. Over a full decade, more than one in three still produced negative returns.
Now consider what happened when investors accessed that same sector through a diversified vehicle - a mutual fund or ETF. Over ten years, not a single technology mutual fund or ETF tracked by Morningstar lost money. Zero out of 73. Over five years, only 16.7% did. The difference between those two outcomes is not the sector. It is the structure.
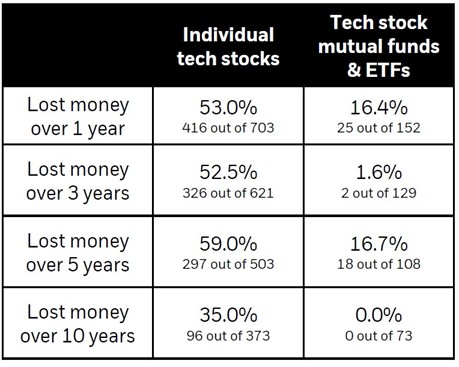
Source: Morningstar/Blackrock
Looking Ahead
Corporate earnings, which are the true long-term driver of stock prices, remain solid. FactSet estimates earnings growth of approximately 13% for the S&P 500 in the first quarter of 2026, which, if realized, would mark continued healthy expansion. Notably, that growth is expected to be more broad-based than in prior years, no longer concentrated solely in the technology sector. Profit margins remain near record levels.
The Federal Reserve, for its part, remains in a careful holding pattern. With oil-driven inflation threatening to reignite, the Fed has limited room to cut rates, even as some parts of the economy soften. The tension between its dual mandate, price stability and maximum employment, is unlikely to resolve cleanly in the near term. Markets have already priced in much of this ambiguity, which is itself a sign of maturity.
Artificial intelligence continues to reshape industries in ways that are disinflationary over the long term. Even as short-term energy prices push costs higher, the productivity gains being realized across sectors create a meaningful counterforce. The two are not contradictory. They are the competing currents that markets must weigh continuously.
A Note on Risk Tolerance
Periods like this one have a way of revealing something important: the difference between the risk tolerance an investor thinks they have and the one they actually have.
It is not uncommon to feel comfortable with risk during rising markets, only to reassess that comfort when markets decline. Behavioral finance has extensively documented this pattern. Losses tend to be felt more acutely than equivalent gains are appreciated, a phenomenon known as loss aversion. As a result, investors often overestimate their tolerance for risk when times are good and underestimate it when they are not. In many cases, an investor’s true risk tolerance is only revealed during periods of stress, not during the calm.
This is not a character flaw. It is a deeply human response. But it is worth examining honestly, because even the best long-term investment strategy can be undermined by short-term decisions made during moments of discomfort. If this quarter’s volatility caused you to lose sleep, to check your account more frequently than usual, or to feel the urge to make changes, that is useful information. It may mean that your current allocation carries more risk than feels right for you emotionally, even if it is appropriate on paper.
Aligning a portfolio with an appropriate level of risk is not just a mathematical exercise. It is an emotional one. Because a portfolio you can stay in through a difficult quarter will almost always outperform a more aggressive one that you abandon at the wrong moment.
A Closing Thought
There is a meaningful difference between a correction that reveals a fundamental problem and one that reflects a market doing exactly what markets do, periodically recalibrating prices that have run ahead of reality. This quarter was the latter.
For investors who stayed the course this quarter, who resisted the urge to react to headlines and held their diversified portfolios through the turbulence, the lesson is the same one this letter has returned to before. Discipline is not passive. It is one of the hardest things to practice in investing, and one of the most reliably rewarded.
If recent market movements have prompted questions about your portfolio, your risk tolerance, or whether your financial plan still reflects your goals, we encourage you to reach out. That is exactly what we are here for, not just to manage investments, but to help you think clearly during the moments when it is hardest to do so. Plans evolve. Circumstances change. And sometimes a difficult quarter is the best time to revisit assumptions and make sure everything still fits.
The trees may not grow to the sky. But the forest, over time, has always grown.
Registered Representative and Financial Advisor of Park Avenue Securities LLC (PAS). Securities products and advisory services offered through PAS, member FINRA, SIPC. Financial Representative of The Guardian Life Insurance Company of America® (Guardian), New York, NY. PAS is a wholly owned subsidiary of Guardian. National Financial Network is not an affiliate or subsidiary of PAS or Guardian. CA Insurance License Number - 0D23495. Data and rates used were indicative of market conditions as of the date shown. Opinions, estimates, forecasts and statements of financial market trends are based on current market conditions and are subject to change without notice. Opinions mentioned are the authors. References to specific securities, asset classes and financial markets are for illustrative purposes only and do not constitute a solicitation, offer, or recommendation to purchase or sell a security. Past performance is not a guarantee of future results. S&P 500 Index is a market index generally considered representative of the stock market as a whole. The index focuses on the large-cap segment of the U.S. equities market. Indices are unmanaged, and one cannot invest directly in an index. Past performance is not a guarantee of future results. Market data provided by: J.P. Morgan Asset Management, Wall Street Journal, Barron’s, Standard & Poor’s, The Economist, Capital Group
8858148.1 Exp 04/28